
Comment: Charts’ trend lines give lie to climate deniers’ claims
Published 1:30 am Monday, October 13, 2025
By Mark Gongloff / Bloomberg Opinion
Every now and then you come across a piece of evidence that feels strong enough to cut through the noise and change minds.
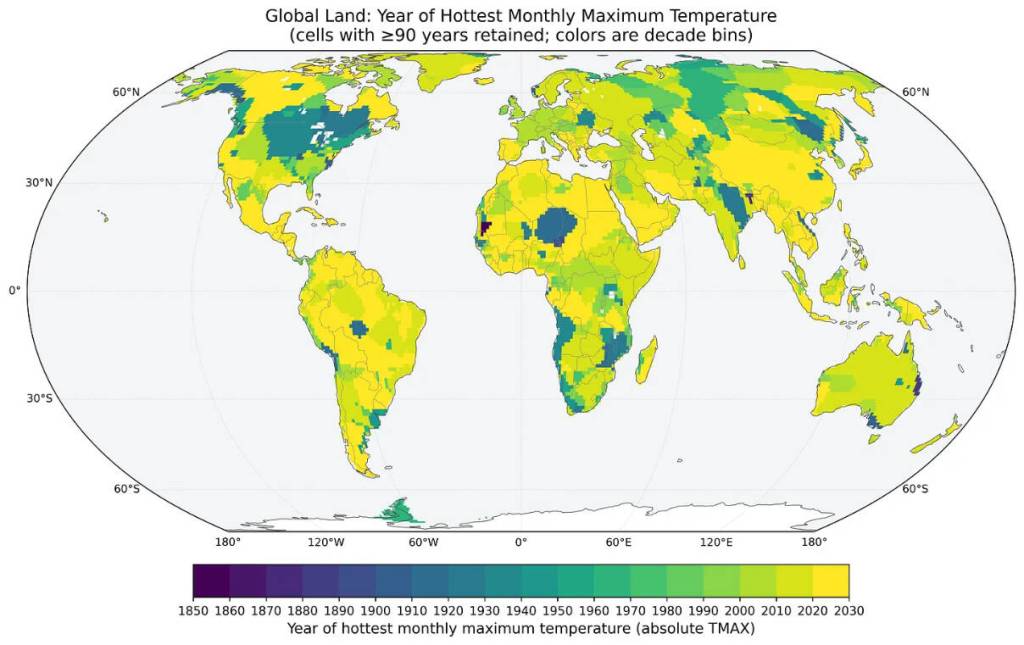
Zeke Hausfather, a climate scientist at Berkeley Earth, recently produced a stark illustration of just how quickly the planet is heating up as a result of the greenhouse gases humans pump into the atmosphere. It’s a chart, published in his Substack newsletter The Climate Brink, breaking down the percentage of the world’s land that has experienced its hottest month on record in each decade since the 1870s.
It reveals that very little of our land surface experienced such records before the 20th century. In contrast, roughly 78 percent of it set temperature records in the 21st century. And 38 percent set records in the 2020s; despite the fact that the decade is only halfway done.
Once more, with fewer numbers: The world is getting hotter, and fast.
This pairs well with another eye-opening chart from the National Aeronautics and Space Administration showing the change in average global surface temperature over the past 145 years. That has risen more or less steadily over the past five decades, recently hitting 1.3 degrees Celsius (about 2.3 degrees Fahrenheit) above the 1951-1980 average. We’re getting dangerously close to the stretch goal of the 2015 Paris agreement to limit heating to 1.5C above pre-industrial averages, which roughly match the NASA baseline.
These graphics directly refute at least two big talking points climate-change deniers use to slow action and keep the world burning fossil fuels longer.
First, they give the lie to the central made-up fact in this recent diatribe from President Donald Trump, the world’s denier-in-chief, delivered at the United Nations:
“If you look back years ago, in the 1920s and the 1930s, they said, ‘Global cooling will kill the world. We have to do something.’ Then they said global warming will kill the world, but then it started getting cooler. So now they just call it climate change because that way they can’t miss. Climate change because if it goes higher or lower, whatever the hell happens, there’s climate change. It’s the greatest con job ever perpetrated on the world, in my opinion.”
As you can see in the charts, the world may have cooled for a stretch of decades after the 1930s (more on this later), but has gotten steadily hotter since the 1970s. If anything, the past 100 years have been the hottest in recorded human history, as you can see in another striking chart published in 2023 by Andrew Dessler, a climate scientist at Texas A&M University and Hausfather’s co-author at The Climate Brink. It tracks global temperatures since the latest ice age and projects them thousands of years into the future to show how we’re reversing an ice age’s worth of planetary cooling in the blink of a geological eye. It takes an epochal discharge of carbon dioxide to accomplish such a feat.
The second denier bromide these charts address is the myth that the world was hotter in the 1930s, as Trump’s Department of Energy recently suggested in its 141-page attempt to rebut established climate science, an effort widely derided as a failure.
It is true the U.S. was unusually hot during the Dust Bowl decade, when heat-wave intensity in the lower 48 states was the highest on record, according to Environmental Protection Agency data. In fact, Hausfather’s chart shows that about 3 percent of 1930s temperature records still stand. That includes parts of the U.S.
But this was a local anomaly, not a global trend. America’s Dust Bowl climate was a product of bad farming and bad timing. Land-stripping agricultural practices reduced ground cover, which intensified drought and heat, just in time for a long-lasting spike in ocean temperatures to amplify both. The combination generated excess heat that reached all the way to Europe. Meanwhile, the rest of the world carried on being as cool as ever. The localized heat quickly dissipated once the ocean cooled and we stopped mistreating the land.
Now that heat has come roaring back to the U.S. and the rest of the world after decades of humanity generating heat-trapping gases. At the rate we’re going, the Dust Bowl era will come to seem like a cool interlude in comparison. This is a global trend, and cherry-picking data to deny its reality is a tactic meant to distract us from the work we must do to stop it. Waving around charts like these is only the beginning.
Mark Gongloff is a Bloomberg Opinion editor and columnist covering climate change. He previously worked for Fortune.com, the Huffington Post and the Wall Street Journal.