How will climate change affect you? New tool gives an educated guess
Published 1:30 am Wednesday, February 21, 2024


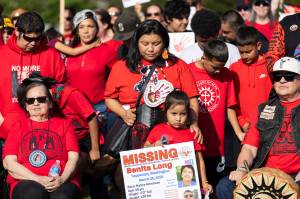
EVERETT — As the planet warms, it is no secret that Snohomish County residents will grapple with more wildfires, floods and other natural disasters. But some neighborhoods will suffer more than others.
This month, Snohomish County launched the Climate Vulnerability Tool as a way to illustrate how climate change trends will affect residents, depending on where they live in the county.
The interactive tool will help Snohomish County leaders identify “where folks are less able to mitigate and adapt” due to climate change and “where programs can be most helpful,” said Eileen Canola, a senior planner with the county.
In July 2022, the state Department of Commerce awarded $99,000 for Snohomish County officials to outline the county’s efforts to address climate change.
County leaders used the money to hire the consultants who compiled the Snohomish County Climate Change Vulnerability and Risk Assessment Report and designed the first version of the Climate Vulnerability Tool.
After the consultants completed the initial tool, county GIS analyst Jesse Langdon spent about six months making it more accessible and user-friendly. His version allows readers to visualize the county climate change report.
“We wanted the tool to be something that was actually more valuable long-term,” Langdon said. “Reports kind of get looked at and it gets shelved.”
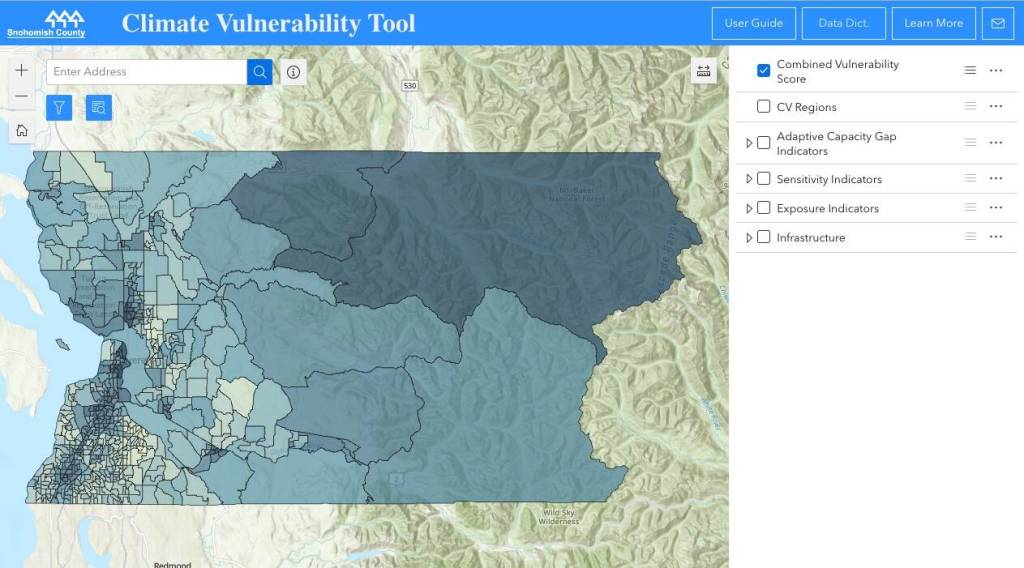
As soon as residents open the tool’s website, they can type in their address in the upper left corner and see exactly how their neighborhood may be affected by climate change.
The tool assigned each census block in Snohomish County with a “combined vulnerability score” that indicates how impending climate change effects vary throughout the county. The U.S. Census Bureau uses population to determine the size of the blocks, Langdon explained, so areas with high population density tend to have smaller blocks.
Think of the combined vulnerability score as you would a percentile ranking you receive when your doctor examines your height, Langdon said. If the doctor said you’re in the 95th percentile for height, you are taller than 95% of people your age.
Similarly, climate trends predict Darrington and its neighboring section of the Mt. Baker-Snoqualmie National Forest have a combined vulnerability score of 64. This census block is 64% more vulnerable to climate change than the other 573 in Snohomish County.
Risks of wildfires, extreme heat and reduced snowpack contribute to Darrington’s higher-than-average score.
The average combined vulnerability score in Snohomish County is 42.
To determine each score, data analysts considered three indicators: sensitivity, exposure and “adaptive capacity gap,” a measure of how factors like income and vehicle access affect locals’ ability to adjust to change.
Knowing information, such as the number of residents who don’t own a vehicle, can help the county, especially in regions more vulnerable to wildfires, Langdon said.
“Can people get out of there or are they gonna be stuck?” he said.
Sensitivity data sets, compiled from the Centers for Disease Control and Prevention, measure how characteristics like age and physical health can affect locals’ vulnerability to climate hazards. And exposure data, as measured by the University of Washington’s Climate Impacts Group, highlights an area’s risk for wildfires and extreme precipitation, among other natural disasters.
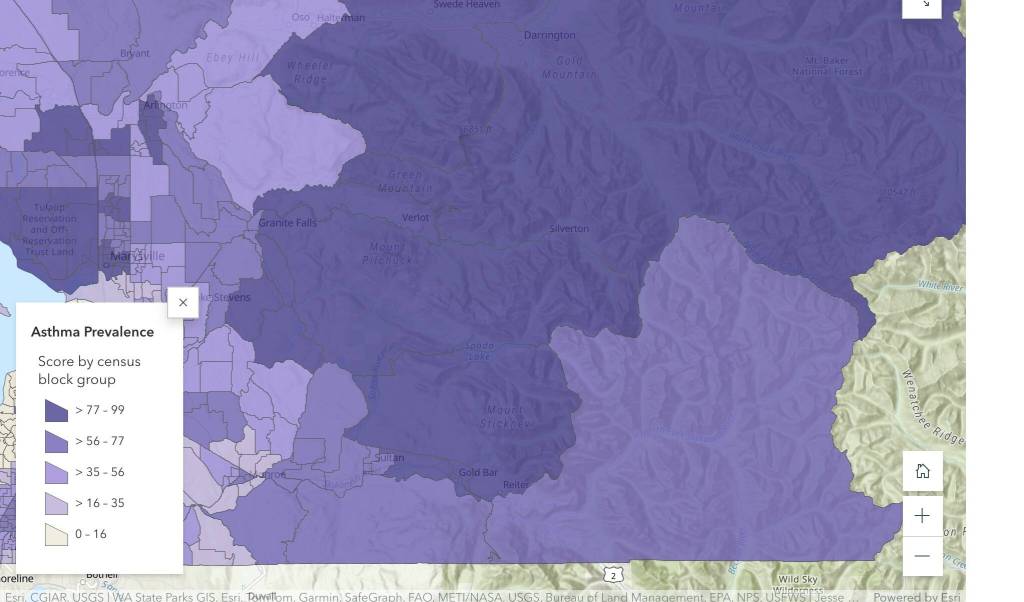
When using the tool, residents can also isolate certain data sets within the three indicators. To see which communities have high rates of asthma, for example, a user could select “asthma” under the “sensitivity indicators.”
Locals can also interpret a neighborhood’s vulnerability by looking at the shades of colors in the tool.
“Dark areas are areas that are potentially going to be, cumulatively, more impacted by projected climate change,” Langdon said.
Residents can find more information about environmental health disparities in Snohomish County through an interactive map developed by the state Department of Health.
County staff plan to update the tool periodically, as officials gather more information about local climate trends.
Ta’Leah Van Sistine: 425-339-3460; taleah.vansistine@heraldnet.com; Twitter: @TaLeahRoseV.