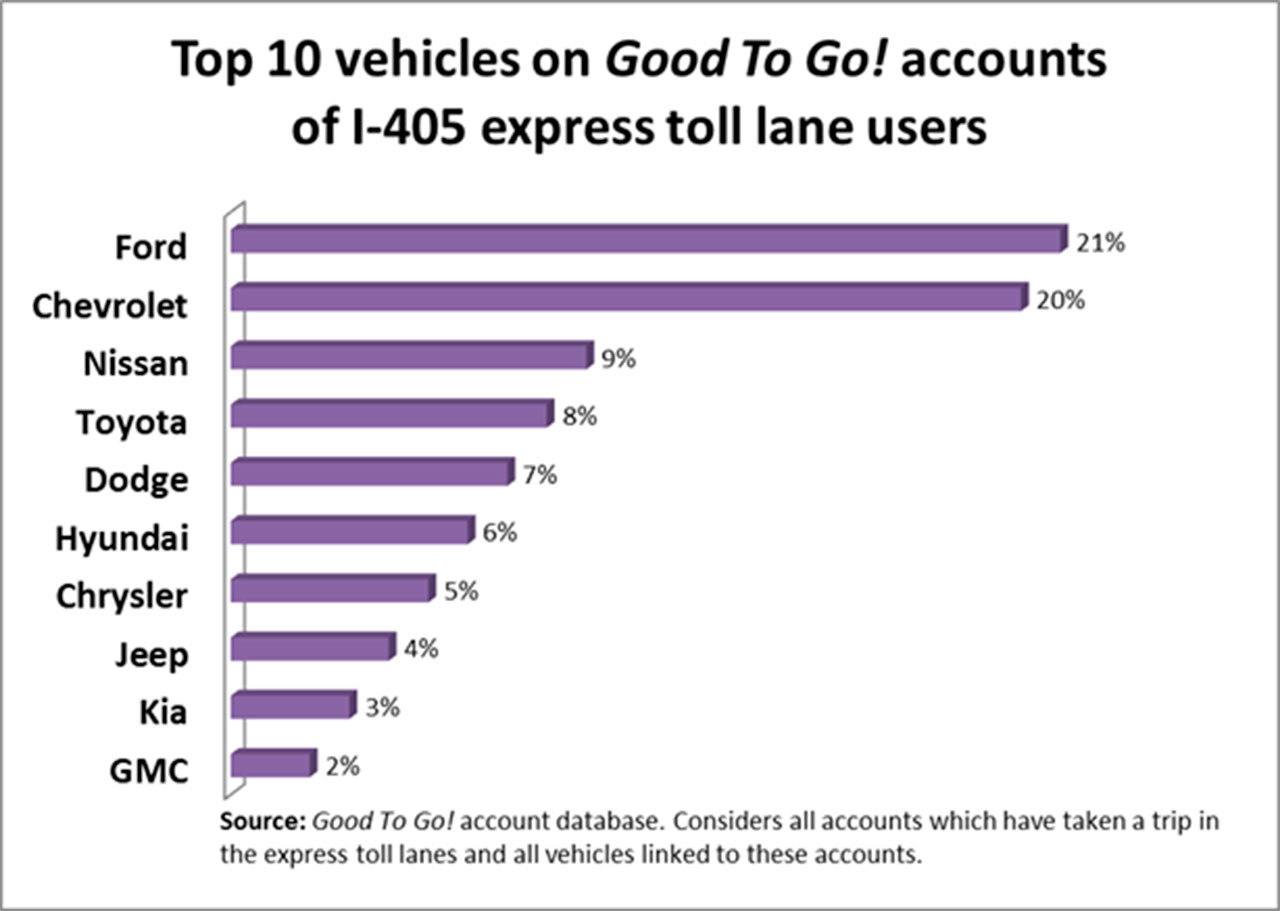
You’re most likely to see Chevys and Fords pass you in the I-405 express toll lanes. At least in theory.
That’s according to a graphic provided by the Washington State Department of Transportation that lists the most popular makes of vehicles that are linked to Good To Go accounts that have logged at least one trip in the toll lanes.
The namesake of the “Lexus Lanes” criticism of the toll lanes barely breaks one-quarter of one percent. Tesla, even fewer. In fact, none of the luxury brands broke 1 percent.
Of course, that’s more fun fact than relevant point.
Who uses the lanes and whether it’s fair is a topic Street Smarts first covered back in May 2015, as we anticipated the dawn of tolling on I-405 that fall. If you haven’t read it or need to refresh your memory, you can find it at http://bit.ly/2dDSvOL.
The vehicle data on I-405 is the same type of information the state shared for that 2015 story based on users of the Highway 167 high-occupancy toll (HOT) lanes. The state can only pinpoint accounts that have logged trips, not which cars under those accounts made the trip. The I-405 pool included 130,000 vehicles when the count was made in August.
As seen from other state data we requested, the brand favorites of bootstrappin’, mud flyin’ TV commercials doesn’t quite capture who’s most likely to pay to get a reliable trip. The “average Joe” looks a lot different south of the county line.
In April, the state took a survey of more than 19,500 Good To Go account-holders who had used the I-405 express toll lanes.
ºThe majority of those toll-lane drivers reported hefty household incomes. About 66 percent had household incomes above $100,000. (The median household income for Snohomish County is $69,443. About 4 in 10 toll lane users enter from Snohomish County.)
That breakdown isn’t a big surprise for a 17-mile corridor that primarily hits Eastside suburbs in King County. Kirkland, Redmond and Bellevue each top $90,000 for median household income.
“I-405 is a very affluent corridor,” said WSDOT spokesman Ethan Bergerson. “It’s a geography where the more higher income people are likely to live.”
Those who have used the lanes cross the spectrum for income, Bergerson added.
Overall, nearly 6 in 10 said they appreciate having the option to use the lanes when they need them. Most of those who paid a toll only did so a handful of times in a given month, compared to 34 percent who reported using them on at least a weekly basis.
The survey didn’t go to anybody who paid tolls by mail.
In other demographic notes, the survey found that men are more likely than women to travel in the lanes. Nearly half of toll lane drivers fell in the 35-54 age range. Many likely don’t have kids, with 51 percent reporting household sizes of one or two.
Below is a snapshot of some of the other survey findings:
7 percent: Paid a toll of $9.25 or higher
20 percent: Have not paid more than $1
6-10 minutes: Most common selection for average time saved per one-way toll lanes trip (30 percent)
36 percent: Use the toll lanes toll-free in a typical week
53 percent: Used toll lanes to avoid congestion
33 percent: Used toll lanes to get somewhere on time
61 percent: Satisfied or very satisfied with speed in toll lanes
39 percent: Agreed or strongly agreed that the toll lanes improved their commute or travel
40 percent: Disagreed or strongly disagreed that the toll lanes improved their commute or travel
51 percent: Disagreed or strongly disagreed toll lanes should be opened in more places in our region
59 percent: Disagreed or strongly disagreed toll lanes relieve traffic congestion
Source: WSDOT
Talk to us
> Give us your news tips.
> Send us a letter to the editor.
> More Herald contact information.


